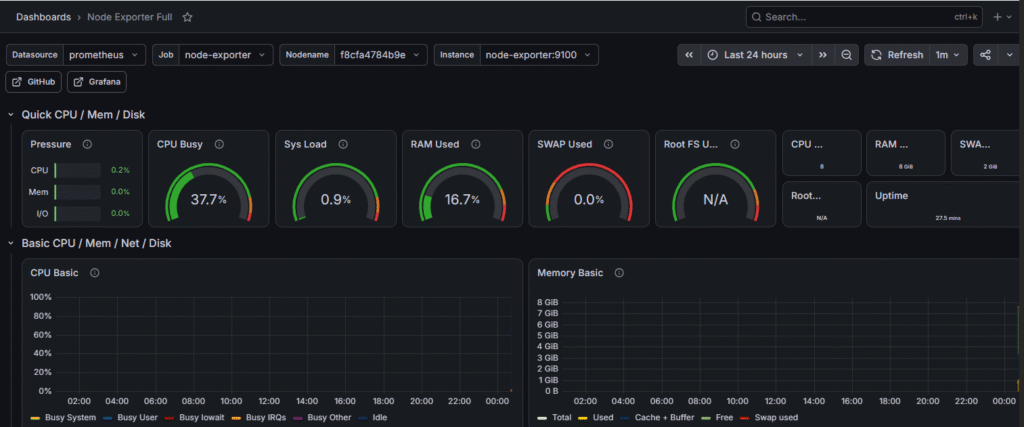
All screenshots in this post are from my own local lab setup — no stock images or third-party demos.
I’ve been wanting to properly learn two things for a while: how Docker actually works under the hood, and what “observability” means beyond the buzzword. Rather than reading another whitepaper, I gave myself a weekend and one goal — stand up a real observability stack from scratch, break it, fix it, and understand every piece well enough to write about it. This post is the result of that weekend.
As a Technical Team Lead sitting across Service Desk operations, M365, and Identity, most of my day is spent reacting — a ticket comes in, an incident bridge opens, and we go looking for root cause after the fact. Observability flips that model: instead of finding out something broke from a user complaint, you see the anomaly forming in real time.
If you come from the same side of the tech spectrum I do — infrastructure, identity, service desk, more comfortable with VMware/Hyper-V than with containers — I’d genuinely encourage you to try this yourself rather than just reading it. It’s a couple of hours on a laptop, it’s completely free, and you’ll come away actually understanding the concepts instead of just recognizing the words next time they come up in an interview or an architecture discussion.
This post walks through standing up a free, fully self-hosted observability stack — Prometheus and Grafana — on Docker, from zero to a live, moving dashboard. Part 2 will cover turning this into an actual incident-detection lab with alerting.
Why Prometheus + Grafana
There are plenty of “free” monitoring tools that gate real functionality behind a paid tier. Prometheus and Grafana are both fully open source with no artificial ceiling — and together they form the de facto industry-standard observability stack, which makes this a genuinely useful skill to demonstrate, not just a home-lab curiosity.
The pipeline is simple to reason about:
Node Exporter (collects OS/hardware metrics) → Prometheus (scrapes and stores them as time series) → Grafana (queries and visualizes)
The Environment
- Windows 11 laptop, 16GB RAM
- Docker Desktop (already installed for another project — this lab runs as a fully isolated Docker Compose stack alongside it, on its own bridge network, with zero interference)
One important caveat I want to be upfront about: Docker Desktop on Windows runs Linux containers inside a WSL2 virtual machine. That means Node Exporter reports the WSL2 VM’s resource view, not native Windows metrics directly. CPU load numbers are meaningfully accurate since the VM shares the physical CPU, but total memory shown will reflect whatever WSL2 has been allocated (by default, roughly half your physical RAM) rather than your laptop’s full physical total. It’s not a misconfiguration — it’s just the architecture of running Linux containers on Windows. I’ll cover getting a native-Windows view using Windows Exporter in a future post.
Why Docker Instead of a Traditional VM (VMware / VirtualBox / Hyper-V)
Before jumping into the setup, it’s worth being clear on why this lab uses Docker rather than a full virtual machine in VMware Workstation, VirtualBox, or Hyper-V — since on the surface both “give you an isolated environment to run software in.”
A traditional VM virtualizes hardware. VMware, VirtualBox, and Hyper-V each run a hypervisor that emulates a full virtual machine — virtual CPU, virtual RAM, virtual disk, virtual NIC — on top of which you install a complete guest operating system (a full Windows Server or Ubuntu install, kernel and all). That guest OS then runs your application. This is heavyweight but gives you very strong isolation: the guest OS genuinely doesn’t know or care what’s running on the host, because as far as it’s concerned, it is the only OS on that hardware.
A container virtualizes the operating system, not the hardware. Docker doesn’t boot a second kernel. Every container on a given host shares the same underlying Linux kernel — Docker just uses kernel features (namespaces and cgroups) to give each container the illusion of its own isolated filesystem, process tree, and network stack, while all of them are actually processes running side-by-side on one shared kernel. There’s no guest OS to boot, no virtual hardware to emulate — which is why a container starts in under a second and a full VM takes 30-90 seconds to boot.
Why this matters practically for this lab:
| Traditional VM (VMware/VirtualBox/Hyper-V) | Docker Container | |
|---|---|---|
| Startup time | 30–90 seconds (full OS boot) | Under 1 second |
| Resource overhead | Each VM needs its own RAM/CPU allocation, full OS footprint (GBs) | Shares host kernel, footprint is just the app (MBs) |
| Isolation strength | Very strong — separate kernel entirely | Weaker — shared kernel, isolated via namespaces |
| What you install | A full OS image, then your app on top | Just your app + its dependencies, packaged as an image |
| Typical use case here | Running a different OS entirely (e.g., a Windows Server VM on a Linux host) | Running many small, disposable services fast (exactly what Prometheus/Grafana/Node Exporter are) |
For an observability stack made of three lightweight, purpose-built services, spinning up three full VMs would be wasteful — gigabytes of disk, minutes of boot time, and three separate OS patch cycles to maintain, just to run three small monitoring daemons. Containers are the right tool precisely because these components are small, stateless-ish, and disposable — you can destroy and recreate any of them in under a second with docker compose up -d.
The catch on Windows specifically — and this is directly relevant to what we ran into with the memory reporting earlier in this lab: Docker containers need a Linux kernel to run on, and Windows doesn’t have one natively. So Docker Desktop quietly runs a lightweight Hyper-V-backed WSL2 Linux VM in the background, and every container actually runs inside that one VM. In other words, on Windows you get one real VM (WSL2) hosting many lightweight containers on top of it — which is exactly why Node Exporter reported the WSL2 VM’s memory ceiling rather than the laptop’s full physical 16GB. On native Linux, there’s no VM layer at all — containers talk to the host kernel directly, which is the “purer” version of how Docker is meant to work.
Step 1: The Compose Stack
Three services, one dedicated Docker network, isolated named volumes so it never touches my other project:
version: '3.8'

networks:
  monitoring:
    driver: bridge

volumes:
  prometheus_data: {}
  grafana_data: {}

services:
  node-exporter:
    image: prom/node-exporter:latest
    container_name: node-exporter
    restart: unless-stopped
    networks:
      - monitoring

  prometheus:
    image: prom/prometheus:latest
    container_name: prometheus
    restart: unless-stopped
    volumes:
      - ./prometheus/prometheus.yml:/etc/prometheus/prometheus.yml
      - prometheus_data:/prometheus
    command:
      - '--config.file=/etc/prometheus/prometheus.yml'
      - '--storage.tsdb.path=/prometheus'
      - '--web.enable-lifecycle'
    ports:
      - "9090:9090"
    networks:
      - monitoring
    depends_on:
      - node-exporter

  grafana:
    image: grafana/grafana:latest
    container_name: grafana
    restart: unless-stopped
    volumes:
      - grafana_data:/var/lib/grafana
    environment:
      - GF_SECURITY_ADMIN_USER=admin
      - GF_SECURITY_ADMIN_PASSWORD=ChangeMe123!
    ports:
      - "3000:3000"
    networks:
      - monitoring
    depends_on:
      - prometheus
Prometheus needs one small config file telling it what to scrape:
global:
  scrape_interval: 15s

scrape_configs:
  - job_name: 'node-exporter'
    static_configs:
      - targets: ['node-exporter:9100']

  - job_name: 'prometheus'
    static_configs:
      - targets: ['localhost:9090']
Then it’s just:
docker compose up -d
Step 2: Confirming Prometheus Is Actually Collecting Data
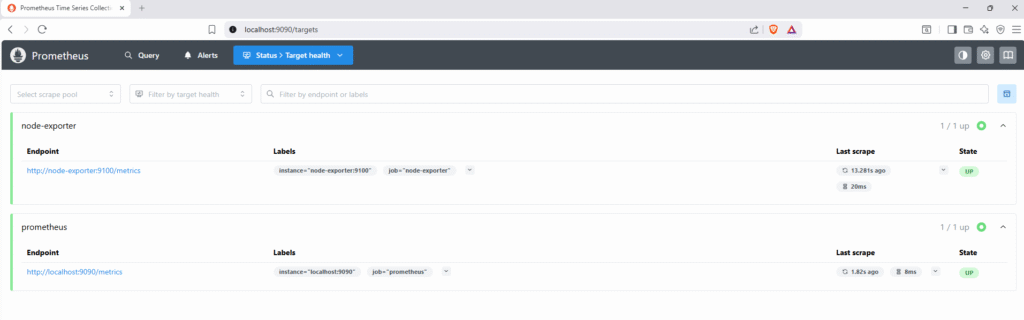
Before touching Grafana at all, I checked Prometheus’s own targets page (localhost:9090/targets) to confirm both node-exporter and prometheus jobs were being scraped successfully.
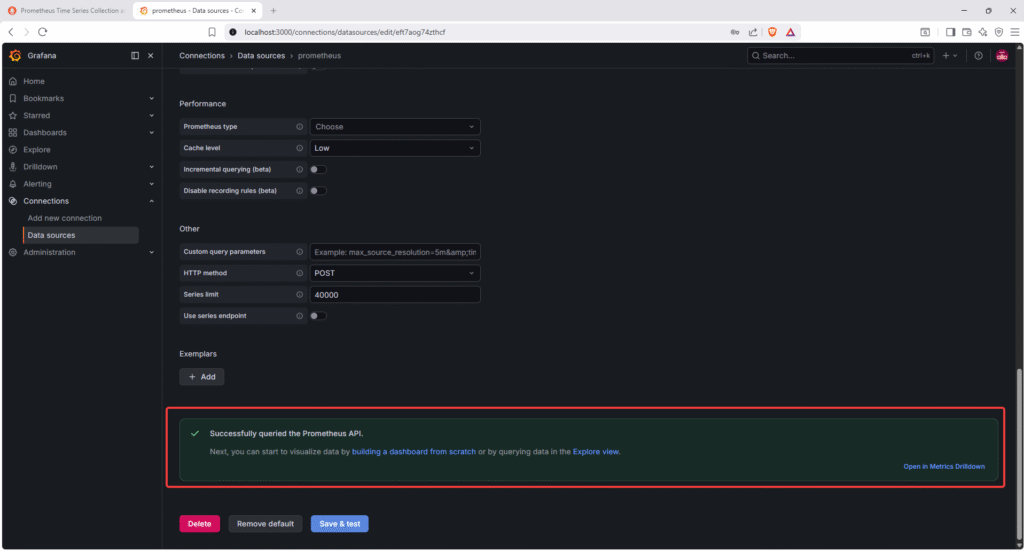
This step matters more than it looks — if Grafana later shows a broken dashboard, the first thing to check is always here, not in Grafana itself. A dashboard is only ever as good as the data source feeding it.
Step 3: A Live Dashboard, Not a Static Screenshot
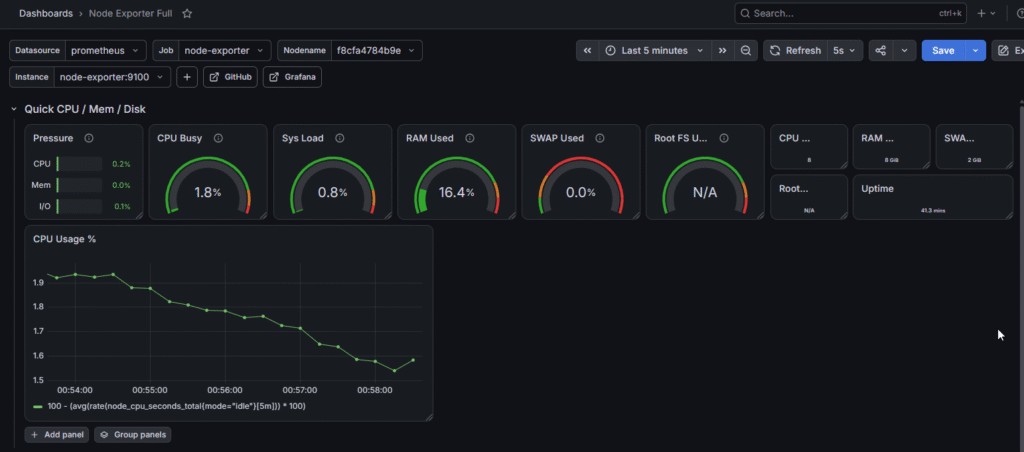
Grafana ships a huge community dashboard library. Rather than building panels from scratch on day one, I imported the standard “Node Exporter Full” dashboard (ID 1860) against my Prometheus data source.
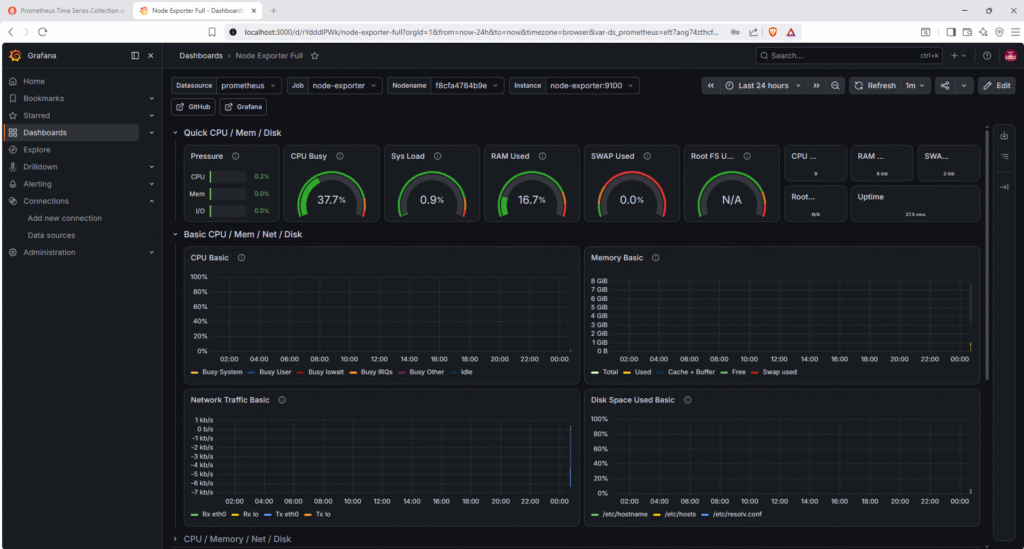
Two settings matter here that tripped me up initially: the dashboard’s time range (top-right) and its refresh interval. Both are per-dashboard settings, separate from Prometheus’s own scrape interval — if either is set wrong, the panels look frozen even though data is flowing correctly underneath.
Step 4: Writing My Own Query
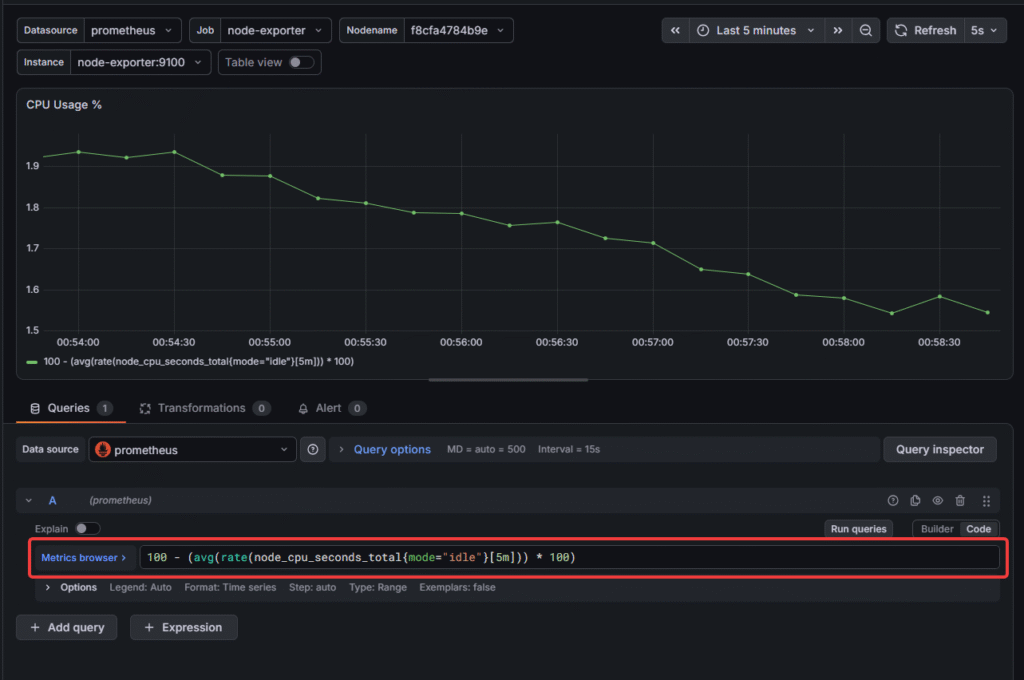
Importing someone else’s dashboard proves you can follow instructions. Writing your own PromQL proves you understand the data. Node Exporter only exposes idle CPU time directly, so calculating active usage means:
100 - (avg(rate(node_cpu_seconds_total{mode="idle"}[5m])) * 100)
This takes the rate of change of idle time over a 5-minute window, averages it across all cores, converts to a percentage, and flips it from “idle” to “active.”
What’s Next
Part 2 will take this stack from passive monitoring into actual observability: writing an alert rule, deliberately triggering a CPU stress event, and capturing the full detect → alert → resolve lifecycle — the same shape as a real major incident, just self-inflicted on purpose.
This lab runs entirely on free, open-source tooling — Docker, Prometheus, and Grafana — no paid tier, no license, no cloud account required.
A Closing Thought
None of this took a lab budget, a cloud subscription, or specialized hardware — just a weekend and a willingness to break things on my own laptop and figure out why. The WSL2 memory mismatch earlier in this post wasn’t something I planned to write about; it happened because I actually built the thing instead of just reading about it, and troubleshooting it taught me more about how Docker works on Windows than any article would have.
If you’re in infra, identity, or service desk like I am, and containers/observability have stayed on your “someday” list — this is genuinely a good weekend to move it off that list. Pick a laptop, follow along, and see what breaks. That’s where the real learning happens.